Three weeks ago, WBEZ’s Curious City segment asked why buses bunch in Chicago and what are the options for reducing bunching. As with many popular articles about physics, the piece described interesting facts while conveying a slightly incorrect intuition about the phenomenon.
The process of transit vehicle bunching requires only that customers loading causes delays. Customer caused delay is both necessary[1]Technically, a delay correlated with the time gap to the bus in front is necessary. In practice, only customer caused delays have this property. and sufficient to create bunching. Customers arriving at each stop at a constant rate create a delay for the next transit vehicle to arrive due to time required to board. The speed of the vehicle thus decreases in proportion to the excess time gap ahead of it, quadratically increasing the size of the gap over time. Through this mechanism, vehicles departing at equal intervals are in an unstable equilibrium. Any deviation from equal time intervals, identical driving, or constant customer demand will become amplified and cause bunching.
Unfortunately, customers arrive at stops stochastically (randomly). Customer demand along a route is never constant but rather a Poisson process at each stop[2]It’s not exactly Poisson as not all customer arrivals are independent. Some customers arrive in pairs or a group may arrive when a stoplight allows them to cross the street. These correlations … Continue reading. This forces vehicles schedules off of their unstable equilibrium and guarantees bunching if no intervention is provided. This simulation demonstrates transit bunching caused solely by customers.
WBEZ’s Curious City concluded that bus bunching is inevitable. This is incorrect. While the dynamics that cause bunching are inherent in transit operation, they can be counteracted effectively by reducing the amount of delay each added passenger causes and by various techniques to keep buses equally spaced. The Itinerant Urbanist stated that bus bunching can be solved by making the choice to dedicated rights of way and remove automotive congestion from the path of buses. However, this isn’t a complete solution to bunching. While traffic congestion, stop lights, and other encounters can increase the variance in bus delays, they do not cause bunching on their own. Constant congestion causes vehicle bunching in space, not in time. The more important effect of congestion is that it interferes with the scheduling of layovers used to mitigate bunching. Dedicated lanes are only one of several tools that used in combination can eliminate bunching.
How quickly transit vehicles bunch is proportional to the square of the bunching force and to the variance in customer demand. To combat bus bunching, the bunching force and variance should be minimized and a counteracting force introduced to keep buses apart. As noted in the WBEZ article by the CTA, all of these courses of action involve either increased cost or an immediate passenger inconvenience. However, eliminating the cost imposed on customers by transit bunching is worth many of these added inconveniences.
The most effective mechanism to combat bunching is to minimize the delay caused by customer boarding and alighting. Replacing existing buses with models with more doors and all-door boarding allow customers to reach a door more quickly when alighting and greatly speed up loading and unloading at the cost of fewer seats on the vehicle and a higher risk of fare evasion. Off-board and cashless fare payment eliminates the largest delay in
bus boarding at the cost of fare evasion and installing vending machines. Level boarding eliminates the need to extend ramps, increases accessibility, and speeds boarding and alighting at the cost of concrete infrastructure. On-board passenger etiquette, not standing in the doors of the vehicle, and moving towards the back of the bus, decreases boarding time and increases vehicle capacity at the cost of sore feelings.
Stop consolidation, increasing the distance between stops, is very effective at reducing bunching while reducing the cost of other investments at stops. A transit vehicle is delayed far more by having to stop for one customer than by waiting for each subsequent customer where the vehicle’s already stopped. The effect on bus bunching is greatest from lightly used stops where the probability of not having to stop is 50%. At these stops, the ‘bunching force’ is proportional to the time required to serve the first customer rather than the average time to serve a customer. Stop consolidation has many benefits, but comes at the expense of greater walking distances for customers.
The WBEZ story did not investigate methods to reduce bunching rates, only methods to provide a counter-force to bunching. The traditional counter-force method is to hold a bus at it’s terminus or at timing points until a set scheduled departure time. This resets the gap between buses at equilibrium. This method fails when a bus arrives at its terminus after its scheduled departure, or when the route is sufficiently long where the rate of bunching is faster than the time taken to reach the next terminus. If the equilibrium cannot be reestablished, bunching propagates into the next trip.
When buses are severely delayed on a route, the number of buses required to maintain a constant headway increases. In order to guarantee that the schedule can be followed, a large number of buses and operators need to be kept in reserve at large cost. Alternatively, the headway can be reduced so that the same number of buses can continue to serve the route. This requires real-time knowledge of the average speed and position of buses on the route. This ability has only recently been developed using a GPS in each bus and is being investigated and implemented by many transit agencies.
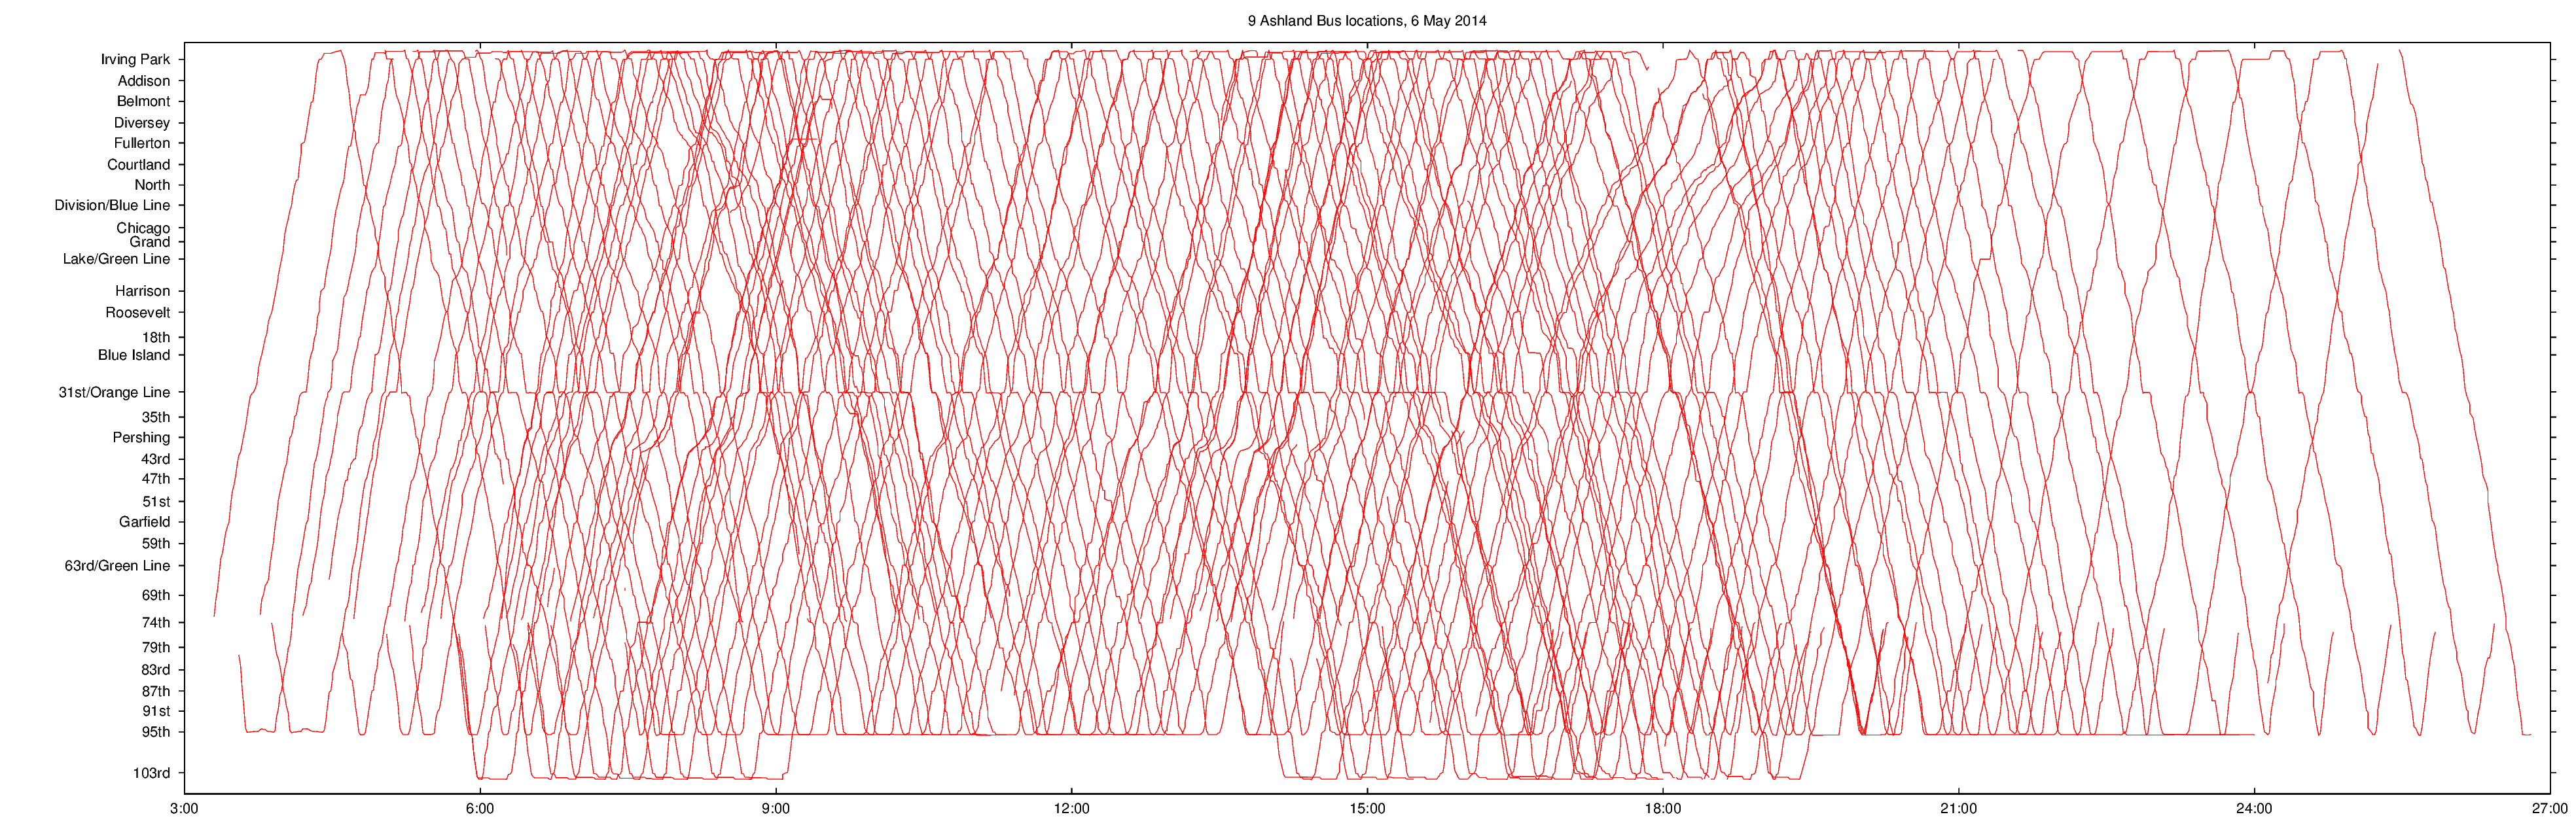
Finally, the WBEZ post investigated how the CTA’s measures of bus bunching, how often a bus the proportion of customers boarding a bus that is within one minute behind another bus, matched the impressions of customers on the street at rush hour. While averaged across the CTA only 3-4% of buses are bunched, the impressions were that more than half were bunched. Both characterizations are true. This conflict occurs because the CTA figure is an average while the customer’s experience is some customers experience’s are mostly from PM rush periods on long busy routes. Below is an image of the 9 Ashland bus from back in May plotted in the style of E.J. Marey. Similar plots for the San Francisco Muni and Toronto’s streetcars can also be found. Severe bunching at large (> 30 minute) gaps is seen starting around 17:00. This occurs nearly every weekday.
| ↑1 | Technically, a delay correlated with the time gap to the bus in front is necessary. In practice, only customer caused delays have this property. |
|---|---|
| ↑2 | It’s not exactly Poisson as not all customer arrivals are independent. Some customers arrive in pairs or a group may arrive when a stoplight allows them to cross the street. These correlations increase the variance in the number of customers a bus must pick up beyond a pure Poisson process. |